Understanding Water Levels
Water levels in Pigeon Lake naturally fluctuate seasonally and over time. The level of the lake is determined by the offsetting balance of water coming into the lake and water leaving the lake.
Water leaving the lake:
Evaporation - The physical process where liquid water absorbs energy from the sun and transforms into gaseous water vapour, escaping into the atmosphere. This is an important step in the water cycle! At Pigeon Lake, water level can decrease by 2.5mm/day during the summer months due to evaporation.
Discharge - The volume of water moving out of the lake. When lake elevation is high enough (849.935 MASL), water flows out of Pigeon Lake through Pigeon Valley Creek and contributes water to the Battle River. Discharge accounts for a minor portion of the water that exits Pigeon Lake.
Water coming into the lake:
Precipitation - Any form of moisture (including rain, snow, sleet, or hail) that falls directly from the atmosphere into the lake.
Runoff - The flow of excess water from rain, snowmelt, or irrigation that cannot be absorbed by the surrounding land. It travels across the land and ultimately deposits into the lake. Lakes can get water contributions from both surface and groundwater runoff!
Pigeon Lake has a relatively small watershed to lake surface area ratio of approximately 2:1. The lake exists because of its ability to capture precipitation from direct rainfall and surface runoff into Pigeon Lake from creeks and ditches. Water flows into the lake through several intermittent streams and one permanent creek. Precipitation that is absorbed into the ground and flows to the lake as groundwater is also important to maintain the lake. Offsetting these inflows is evaporation from the lake, which is very high in late summer when the water temperature is high, as well as the relatively infrequent outflows from the lake through Pigeon Lake Creek. Pigeon Lake discharges through the weir into Pigeon Lake Creek located at the south end of the lake and flows southeast into the Battle River.
To view real-time water level data, visit the Government of Canada Hydrometric Data Website
Interpreting Hydrometric Data Graphs:
Setting up the graph
Date Parameters: Set the date parameters to what you would like. The earlier you set the start date, the longer your date range will be.
Primary Y-Axis Parameters: the easiest graphs to interpret have this set to “Water level (daily mean values). This will allow the graph to be as smooth as possible.
Secondary Y-Axis Parameters: set this to (Second parameter) to remove it from the graph and make it easier to read
Select “Apply Settings” button to update your graph
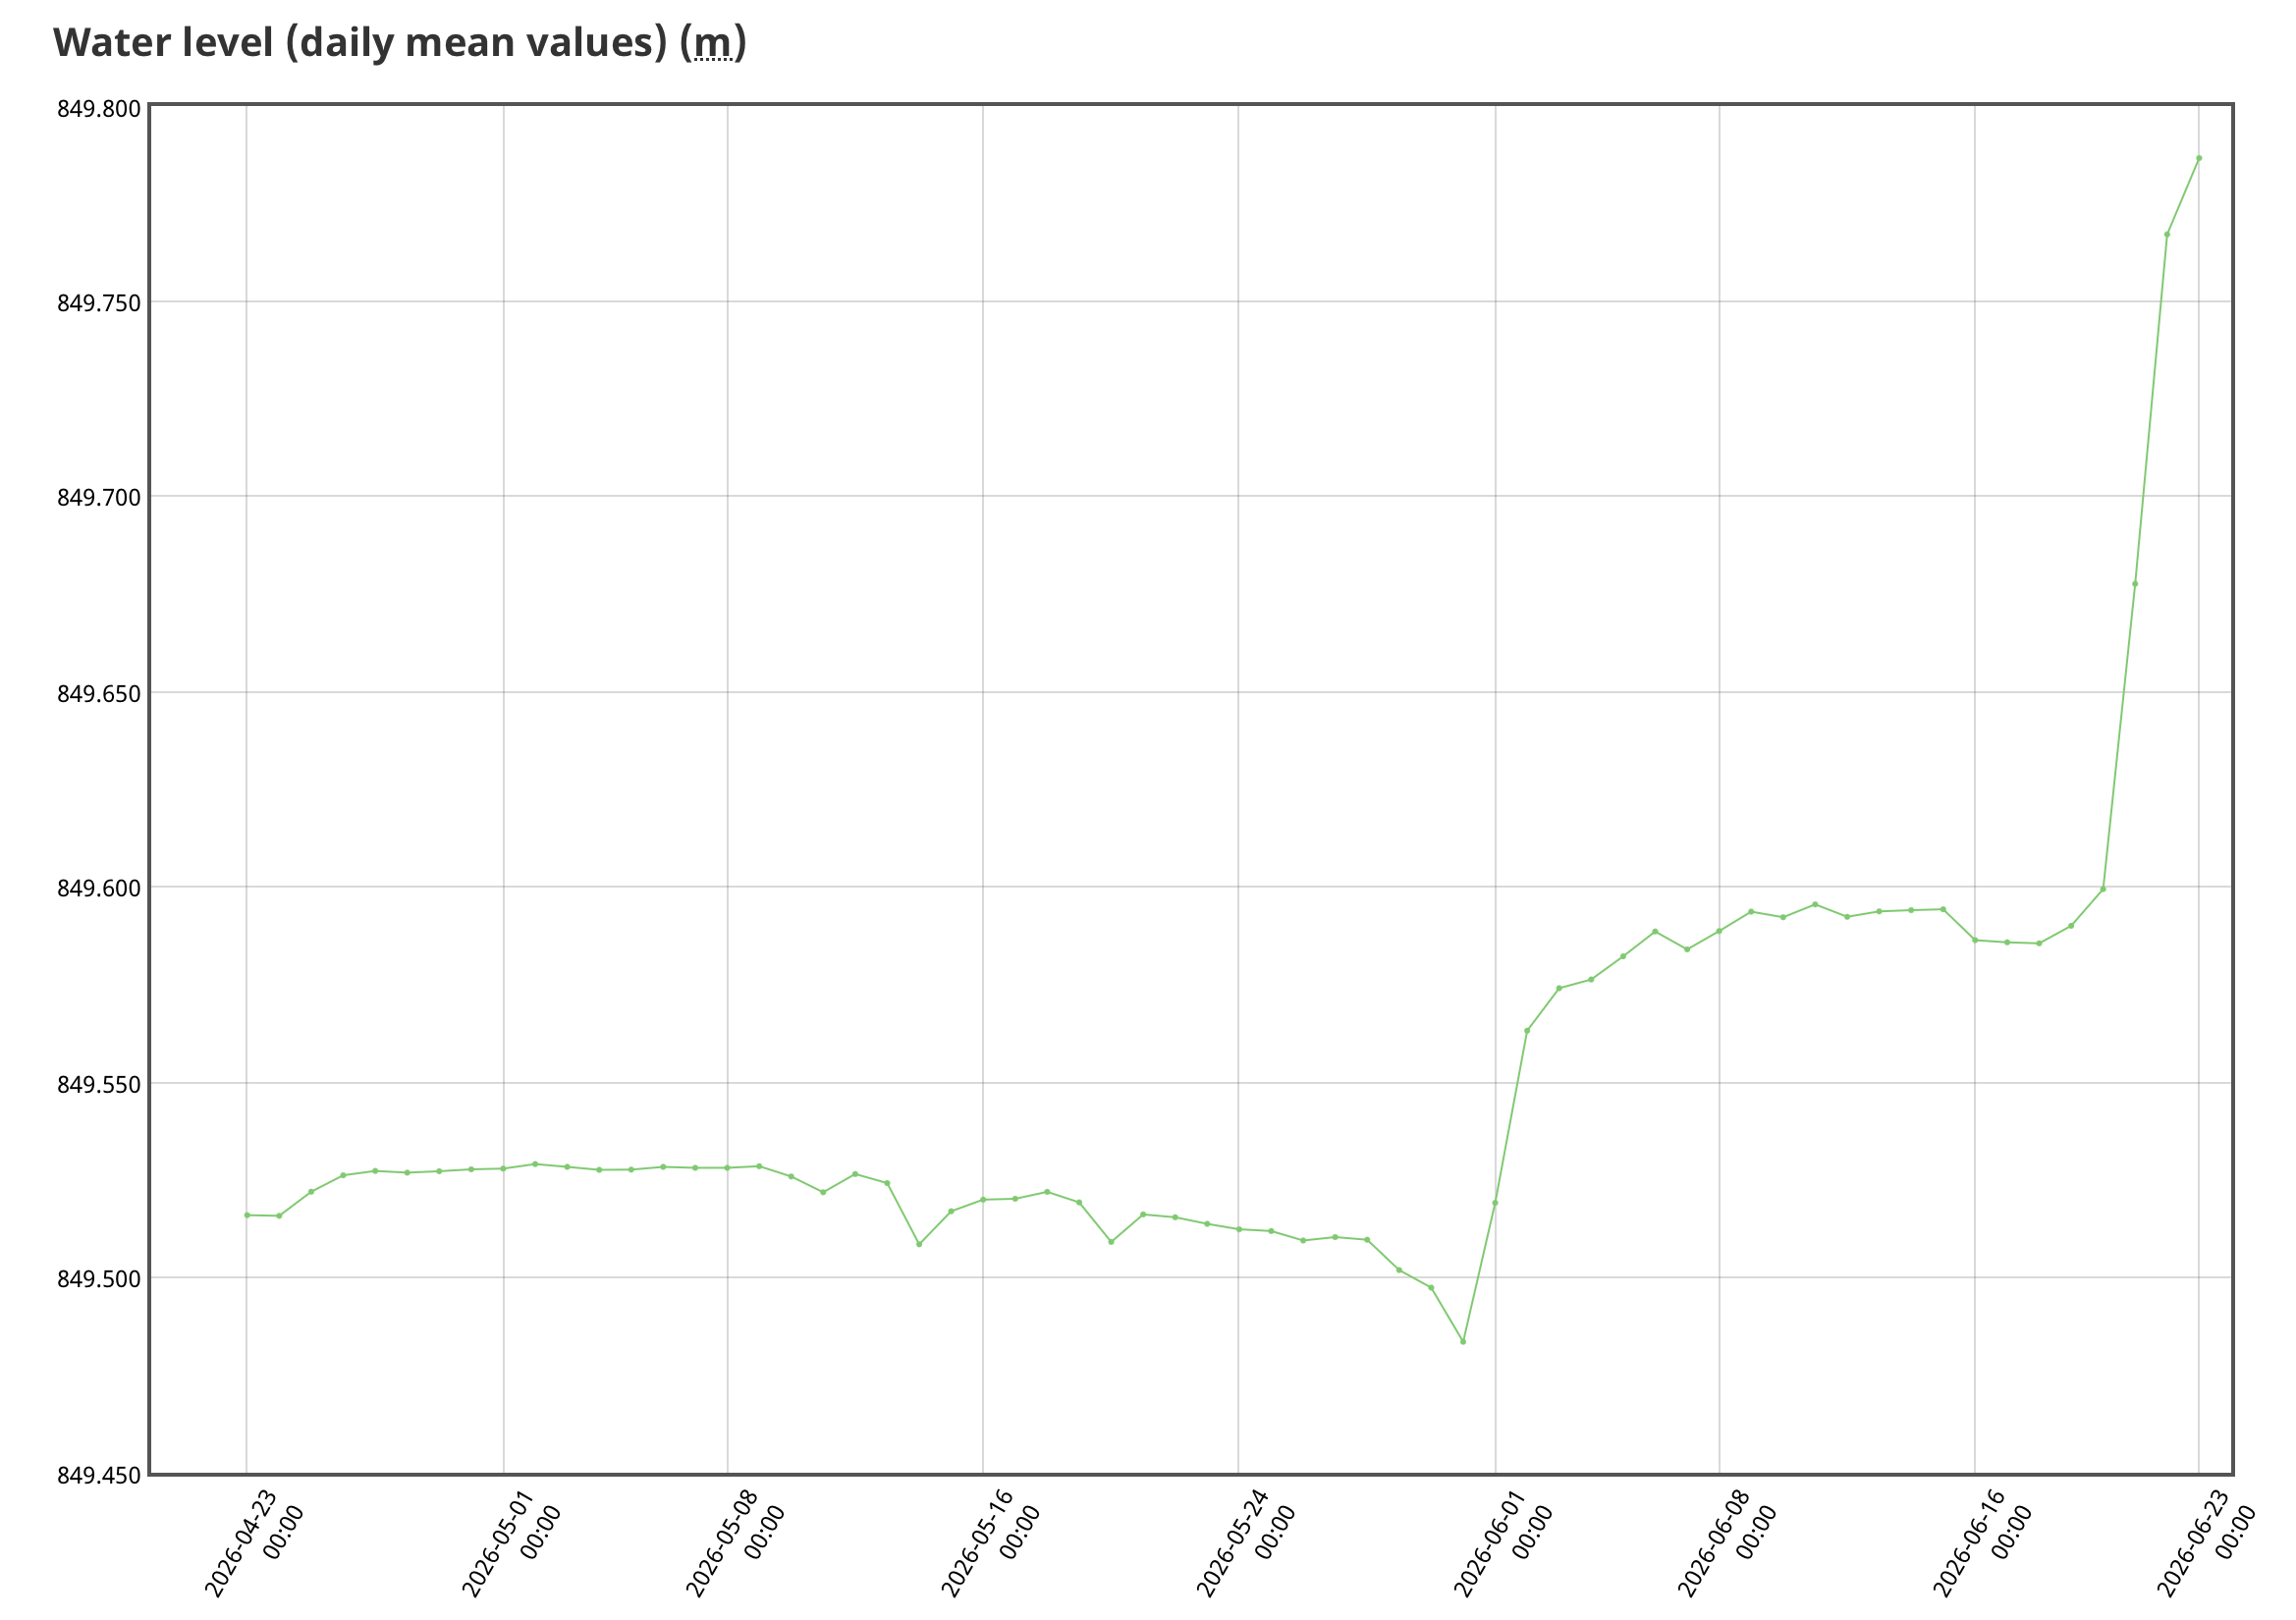
Viewing the graph
Hover your mouse over a data point to learn more. You may need to move your mouse around on the line before you get the pop-up of information related to that point.
When you see the data point information pop up, it will tell you the date the data point was collected, as well as the measurement
Water levels are only collected during the open water season. This explains the gaps in the graph as the winter months, when measurements are not taken.
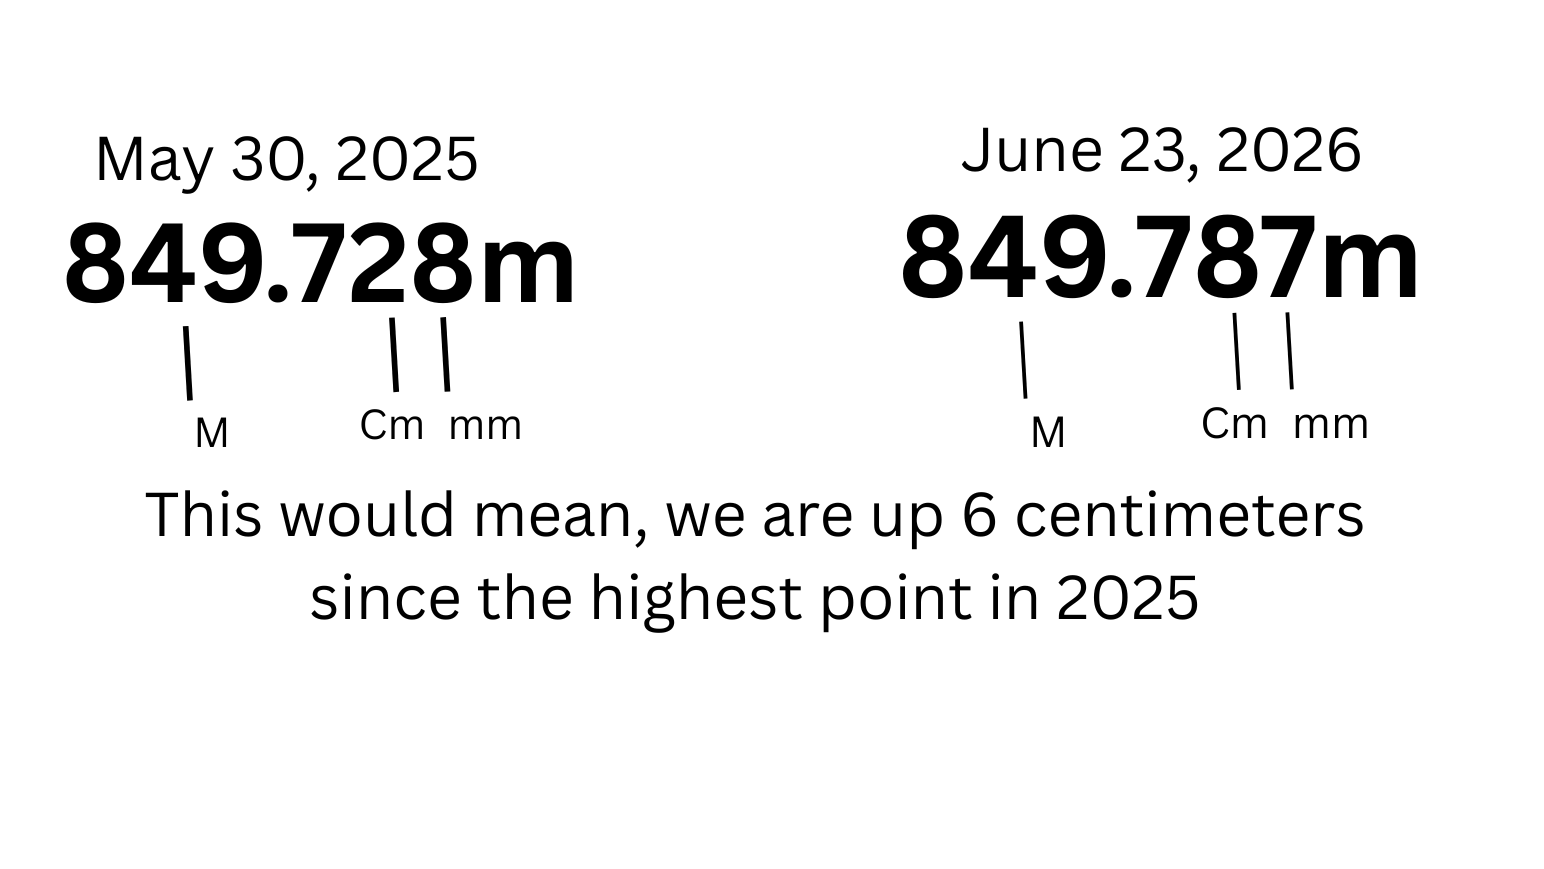
Interpreting water level values:
MASL = Metres Above Sea Level
Measuring lake levels in MASL standardizes data by tying water heights to a fixed, universal baseline. This helps simplify things when comparing lake levels over time, and between water bodies.
It can be challenging to understand water level values in MASL. It is helpful to consider these numbers over time and how they change relative to each other versus trying to determine what a single number means on its own.
In the image below, we have 2 different water level values. You will see that 849 represents the number of meters above sea level. After the decimal, we have centimetres, and then the last number represents millimetres. So between these values, there is a different in 6 centimetres.